A Look at the Arimaa Branching Factor
This started as a project to find out what the average branching factor is in a game of Arimaa. As such things have a tendency to do it grew as I decided to look at different aspects of this.
But since you're probably only interested in this initial question I'll be nice and give the answer now so you can leave and not have to wade through all my little excursions. Using the games played on the arimaa.com server through the end of 2005. The average branching factor in a game of Arimaa is 17,281.
Methods
I used the archive of all games at arimaa.com from 2002-2005 to build the database of games. This includes 23,022 games and 1,272,025 turns played. For each turn the resulting position and the number of unique replies was generated. This was accomplished using a move generator written in python. Which was then placed in a client-server setup using the 7 computers on the home lan to calculate replies. After all positions were generated, several thousand moves and a couple hundred full games were randomly checked for accuracy using the official move generator.
When pulling data from the database the move numbers and side were adjusted to convert number of possible replies to number of possible moves for a given turn.
The number of arrangements in which a player can place the pieces during the opening move is 64,864,800. Since this is a unique and completely separate activity from the rest of the game the first move is excluded during analysis.
All histograms shown have a bucket size of 100.
Per Turn Statistics
First up is a graph showing how the branching factor changes as a game of Arimaa progresses.
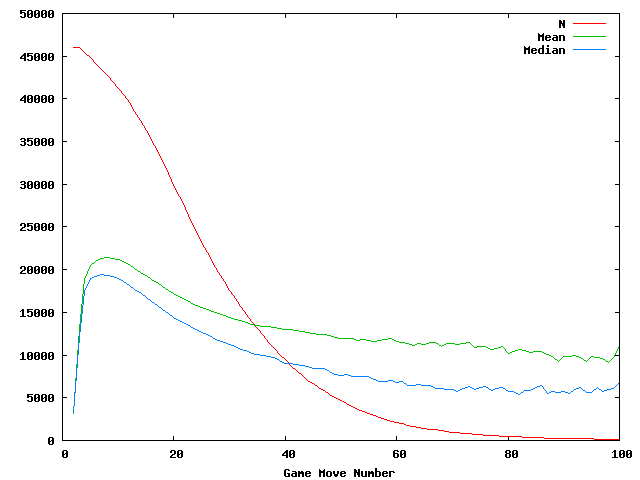
The red line indicates the number of times a particular game turn was seen. This is approximately twice the number of games that lasted long enough to reach that turn. It starts with turn 2 being seen 46,045 times falling until turn 100 was seen 137 times.
The green line shows the mean number of unique moves per turn. It starts at 3,161 possibilities from turn 2 and peaks at turn 8 with 21,465.
The blue line indicates the median number of unique moves. It start at 3,331 for turn 2 and peaks at turn 7 with 19,418 unique moves.
In order to take a closer look at how the number of possible moves varies here are some histograms showing how often a certain number of possible moves is seen.
First here is a histogram showing turn 2.
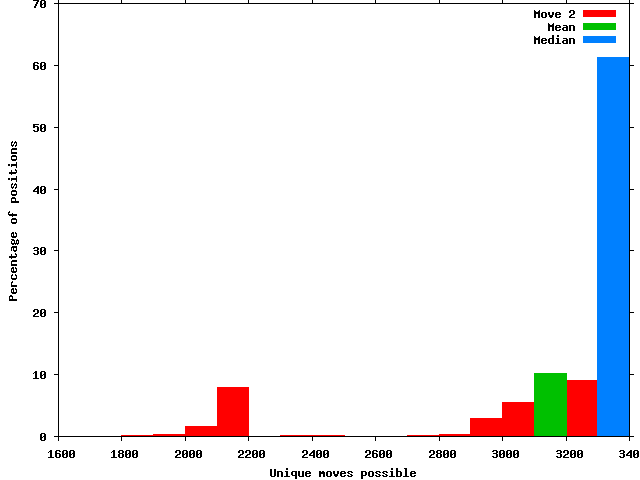
As can be seen the number of possible moves for the second turn is highly constrained. With 61% of positions landing in the 3,300 to 3,400 possible moves bin. In fact 23% of the time turn 2 has 3,353 possible moves.
For turn 3 this spreads out quite a bit.
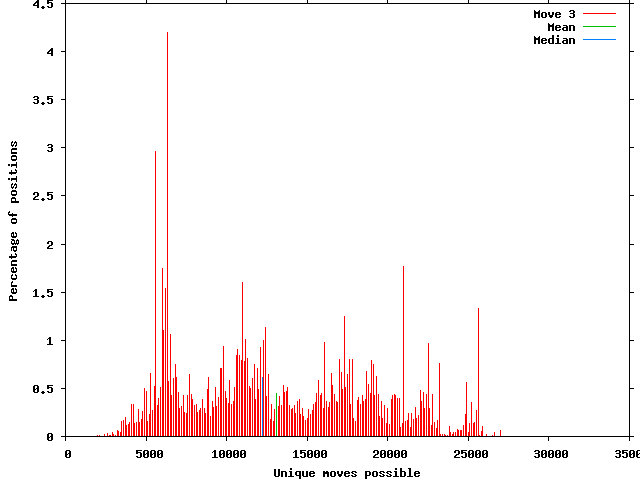
While still seeing several significant peaks the number of possible moves is much more spread out by turn 3. The highest percentage occurs at 6,300 with 4%. The lowest number of possible moves seen was 1,583 and the maximum 32,161. The mean is 13,162 with a SD of 5,927. The median is 12,223.
By turn 4 the highest peak is less than 1%.
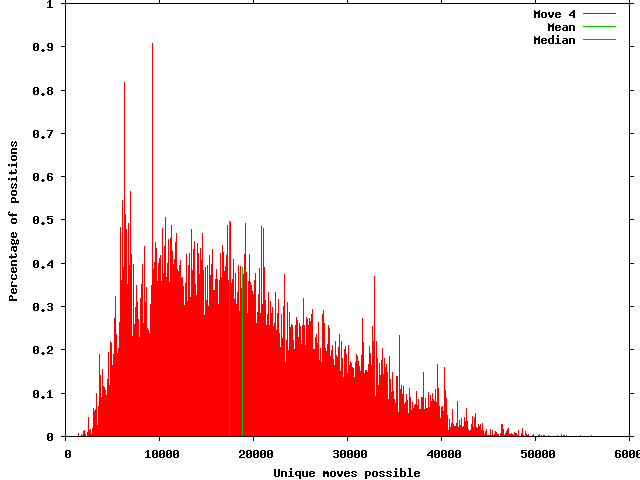
The peak occurs at 9,300 with 0.91% of positions seen. The minimum number of possible moves was 1,436 and the maximum 56,094. The mean has risen to 18,854 and the SD is 9,594. The median number of moves is 17,495.
Here is a small movie showing the histograms from turns 2 through 50:
As the game progresses the tail for maximum moves possible lengthens as the average goes down.
Next is a graph showing the highest number of possible moves seen for each turn number:
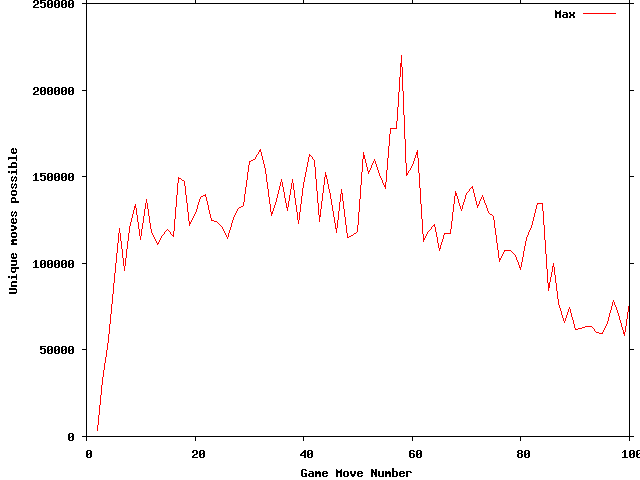
The highest number of unique moves occurred on move 58 with 219,909 possible moves.
Then one showing the minimum number of possible moves for the first several turns:
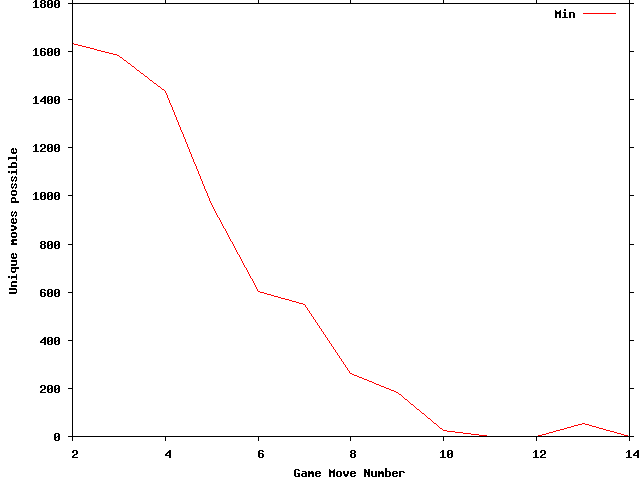
Another somewhat interesting side note; after the first immobilization at move 11 there is no immobilization for move 13 or 16. Then every move up to 80 has an immobilization.
I thought it would be interesting to compare the difference between the winning and losing sides for games that are won by goal.
First the mean and median for both sides throughout the game.
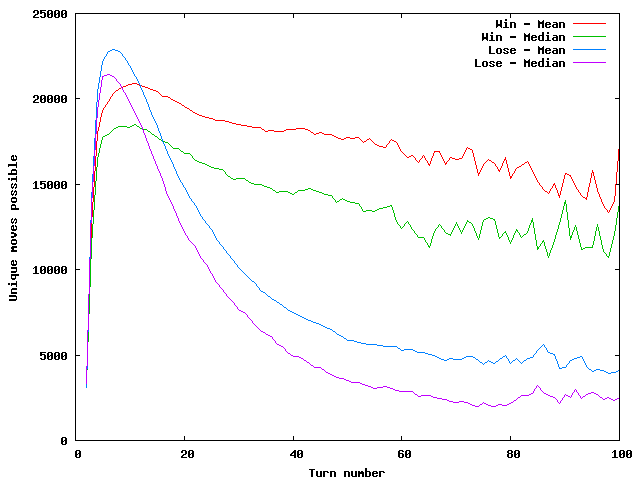
For the losing side the peak mean occurs at turn 7 with 22,892 possible moves. The peak median is at turn 6 with 21,435 possibilities. For the winning side the peak mean and median are at turn 11 with the mean being 20,903 moves and the median 18,501.
And here are histograms for the first 50 moves for the losing side.
The last few moves go off the scale for percentage of turns with a low number of responses. So here is move 50 with the full range.
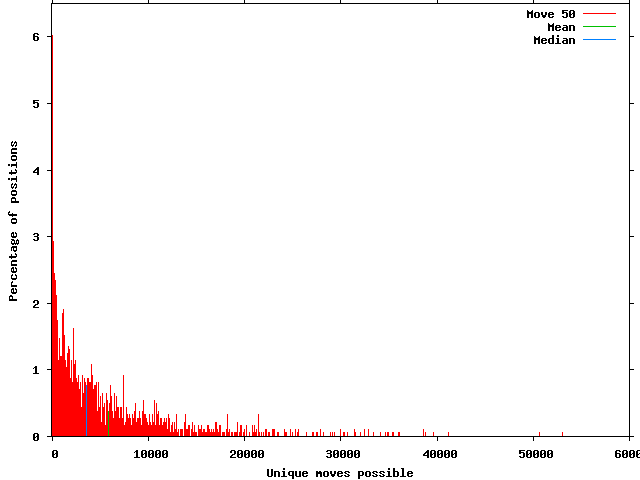
As you can see 6% of the time there are less than 100 responses available.
Then a look at the histograms for the winning side.
As can be seen, when winning by goal the winning side generally has many more possible moves available as the game progress than the losing side.
Overall Game Statistics
Now for a look at full game results.
Possibly the most obvious way to look at full game branching factor is to simply use all the moves in the database giving equal weight to each one.
Here is a histogram of this:
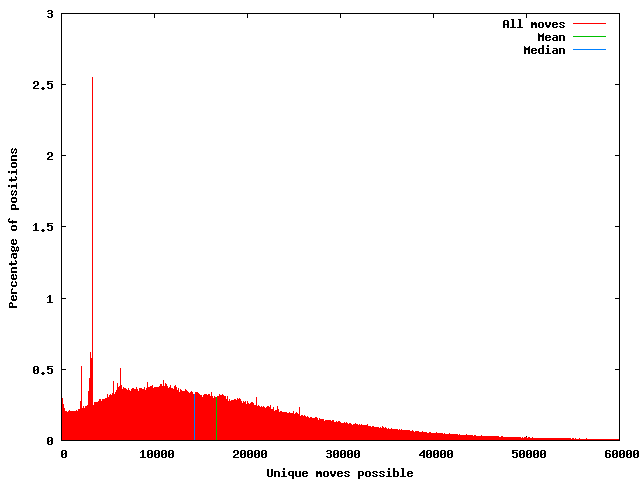
The number of turns included from the database is 1,233,452. The mean number of possible moves is 16,790 with a standard deviation of 12,471. The median is 14,308. The highest percentage of positions occurs at 3,300 with 2.55%.
One possible problem with simply giving equal weight to each move in the database is since there are more early moves the results end up weighted towards them. For example, in the results above move 2 makes up 3.7% of the total number of moves and as seen earlier 61% of those fall into the 3,300 possible moves bucket.
Another way to look at full game results is to give each move number equal weight. This removes the bias towards early moves in that is present in the first method.
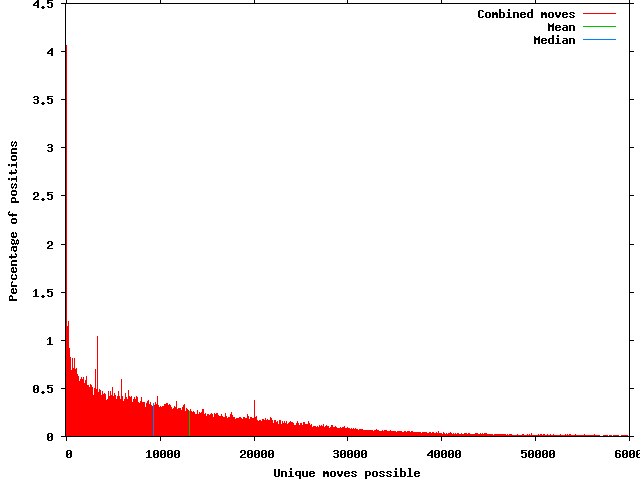
Move numbers that had been played at least 100 times were included. This resulted in using turns 2 through 107. The mean is 13,108 possible moves with a standard deviation of 13,536. The median is 9,320 possible moves. The highest percentage are moves with less than 100 unique replies at 4.06%.
But probably the best way to look at full game results is to actually answer a slightly clarified version of the original question; what is the branching factor for an average game of arimaa? In other words weighting the results so each game is given an equal weight. In order to try and weed out games that were ended before fully developing away from the opening position I left out games that were 5 moves or less and ended either by resignation or time.
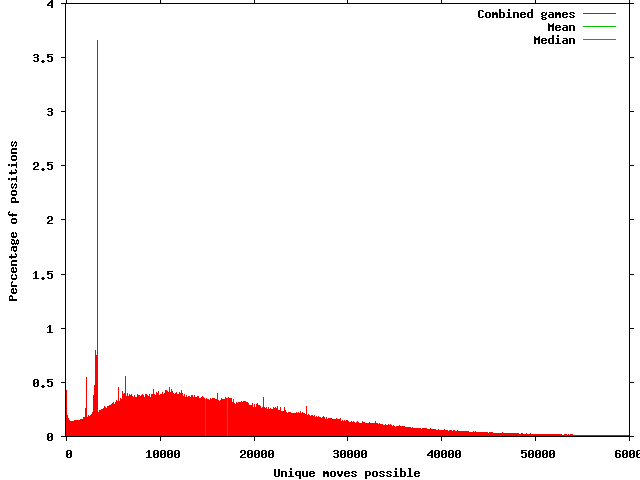
The mean branching factor is 17,281 with a standard deviation of 12,402. The median is 14,889 unique moves.
One last thing before ending. Using the previous method, weighting by game, but only including human versus human games.
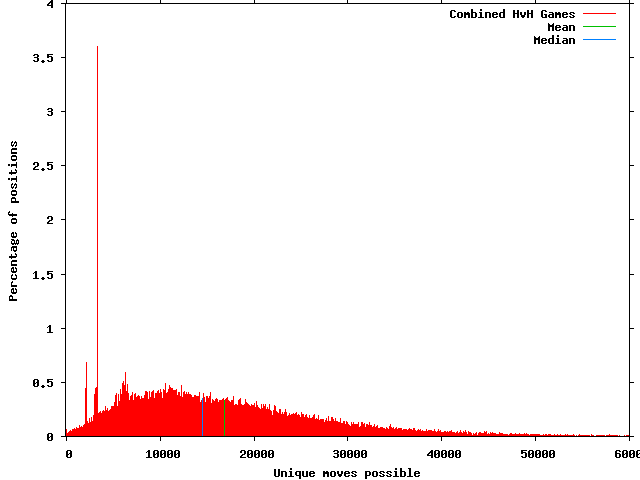
The mean is 16,844 moves with a SD of 11,595. The median is at 14,530. What stands out most to me is the small precentage of positions in human vs. human games with 0 to 1000 unique posible moves. Comparing it to the all game results above; at 0 to 100 moves hvh has .06% and all games is .42%. In the interest of ever getting this released for people to read, I'll wait for another time to take a closer look at this.
Acknowledgments
First thanks to Omar for creating such an interesting and fun game for all of us to enjoy. He has also invested an amazing amount of time and money in support of the game and community.
Thanks to Ryan Cable and Karl "Fritzlein" Juhnke for reviewing the initial draft. Resulting in the correction of several errors. Most important being my reversal of the sides when looking at the winning and losing side for goal games. The results were much more shocking the other way around though. They also provided several new interesting questions to answer.
Special thanks to my Mom not just for all her years of mothering; but in particular for the proofreading and corrections she supplied.
Closing
If you have any corrections or further directions to look into feel free to contact me by email at janzert@janzert.com. In the future I plan to try and look at one small area at a time and post the answer either in the official forums or on my, "very occasionally posted to", blog.
Thanks for reading, Brian "Janzert" Haskin.
